Price and oscillator context
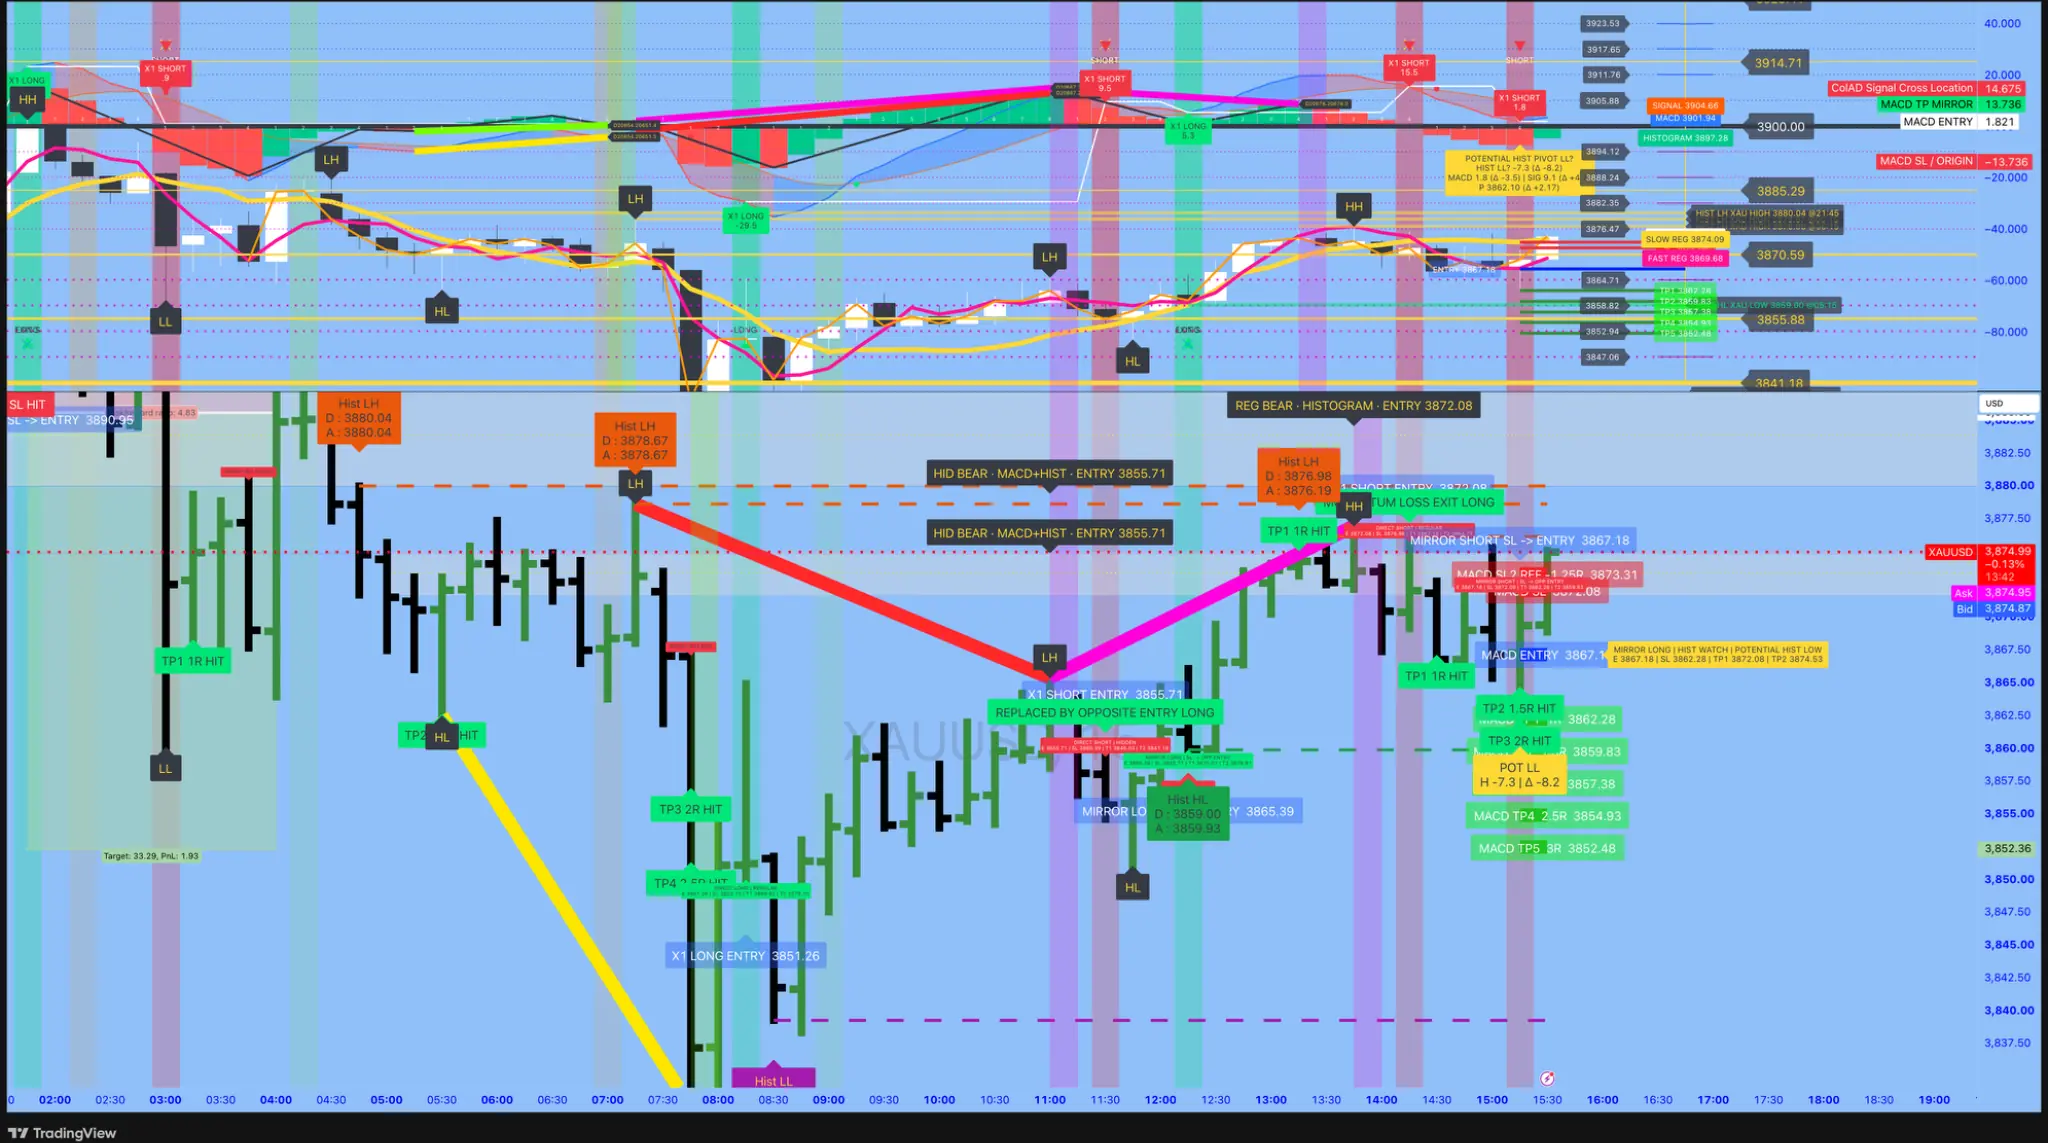
The chart presents price action and the associated oscillator pane side by side so viewers can examine event timing and confirmation.
Research context
XAUMO / EDITORIAL LIBRARY
XAUMO Supernova MACD studies momentum, divergence, pivots and annotated entry/exit context alongside the actual price candles. Learn what bullish and bearish divergence really warn about, how to separate a setup from a fill and how volatility, VWAP and auction structure can confirm or challenge the idea. Public screenshots are historical, not live signals.
ORIGINAL XAUMO TECHNOLOGY
Dated historical research · Not a live trading signal
THE XAUMO APPROACH
The chart presents price action and the associated oscillator pane side by side so viewers can examine event timing and confirmation.
Labels, pivots and directional studies are contextual; they are not an automatic order or a promise about the next candle.
Public exhibition of an owner-provided screenshot does not grant access to unreleased code, internal models or a paid product.
A CLOSER LOOK
The screenshot demonstrates how I explore price action and oscillator behaviour together instead of treating a crossing line as sufficient evidence. Market swings, pivots, changing momentum and the timing of an event may tell very different stories depending on the surrounding context.
The picture is a dated illustration of the XAUMO Supernova MACD research environment. It is neither a current recommendation nor independent evidence of trading profitability. The implementation and any unpublished source code remain private.
MACD examines the relationship between moving averages, their spread and changing momentum. XAUMO Supernova MACD presents oscillator behaviour alongside actual price candles and chart events, so a trader can connect a momentum change to the price swing and candle that produced it instead of reading a disconnected line.
The purpose is to distinguish momentum acceleration, slowing, possible trend continuation and potential exhaustion. An oscillator reading is a layer of evidence, not confirmation that the next candle must move in a specified direction.
A bullish divergence can occur when price makes a lower low while the oscillator forms a higher low. A bearish divergence can occur when price makes a higher high while the oscillator forms a lower high. In both cases the market is offering a possible momentum warning, not an automatic reversal.
A divergence may persist for several candles while the trend continues. The trader should look at the actual price swing, completed candle, nearby invalidation level, market structure and session before deciding whether the warning has become a confirmed scenario.
The chart can annotate candidate entry and exit conditions and relate them to price bars and momentum. An entry label means that a defined setup deserves review at its indicated time and price context; it does not confirm a broker fill. Exit context can include an objective, deteriorating momentum, an invalidated setup or a protective risk rule.
For any candidate, check the completed bar, direction, spread, expected stop distance and whether the reward still justifies the risk. If a MACD divergence conflicts with other directional evidence, the discrepancy should be displayed as a reason for caution rather than disguised as a percentage certainty.
Supernova MACD asks about momentum. VWAP asks where price sits relative to its volume-weighted reference. A consolidation zone shows repeated overlap; Volume Profile identifies volume concentration and value areas; TPO describes time at price; ATR estimates the scale of recent movement. Their readings are complementary and not interchangeable.
Consider a higher high with weakening MACD near a Volume Profile value-area boundary: that is a place to study acceptance, rejection or a possible divergence, not an automatic short. If a MegaBar appears at the same time, its session and follow-through add context before the trader accepts or rejects a plan.
MegaBar can flag the unusual price event; Supernova MACD can inspect momentum, divergence and candidate entry/exit context; Gamma+1 Trader can contribute options/futures and potential hedging context. A member can use the combined research questions to decide where to observe, where the idea fails and when no trade is preferable.
XAUMOBOT is a separately governed notification initiative. If an authorised research-notification integration is activated in the future, its messages must preserve timestamp, source freshness and the difference between analysis and execution. This website does not currently provide a private engine connection, live bot signal or broker order routing.
Supernova MACD is studied alongside the price candles and their swing points, rather than in oscillator isolation. MACD line, signal/histogram behaviour and divergence convey momentum information.
A smaller histogram can reflect deceleration without confirming that the trend has reversed.
Bearish divergence compares a higher high in price with a lower oscillator high; bullish divergence compares a lower price low with a higher oscillator low.
Verify the completed bar, structure, retest, volatility and nearby value. Divergence can persist through continuation.
Displayed entry, stop and target levels describe an analytical candidate; they are not broker fills. Depending on the governed version, different scenario types may include direct, continuation or mirror framing.
Ask which closed-bar condition confirms the idea, where it becomes invalid, and whether volatility/spread still support the risk/reward.
MACD momentum shifts, MegaBar price-structure reversals and options-model Gamma Flip are not the same mechanism.
Agreement is not guaranteed confirmation; conflict must be explained rather than hidden behind a fabricated confidence percentage.
GOLD ON THE NILE / ORIGINAL COMMUNITY RECORD
XAUMO is built on a practical idea: traders deserve to understand why a setup matters, when to wait and what would invalidate a thesis. Education, explanations and public evidence are shared with the wider community; access to proprietary research engines remains selective.
Below are dated, original Gold on the Nile posts: a founder video from an active chart discussion, an advance session plan, an explicit no-trade decision, and the educational Gamma guide previously published for Arabic and English readers. Each item links to its original public Telegram post.
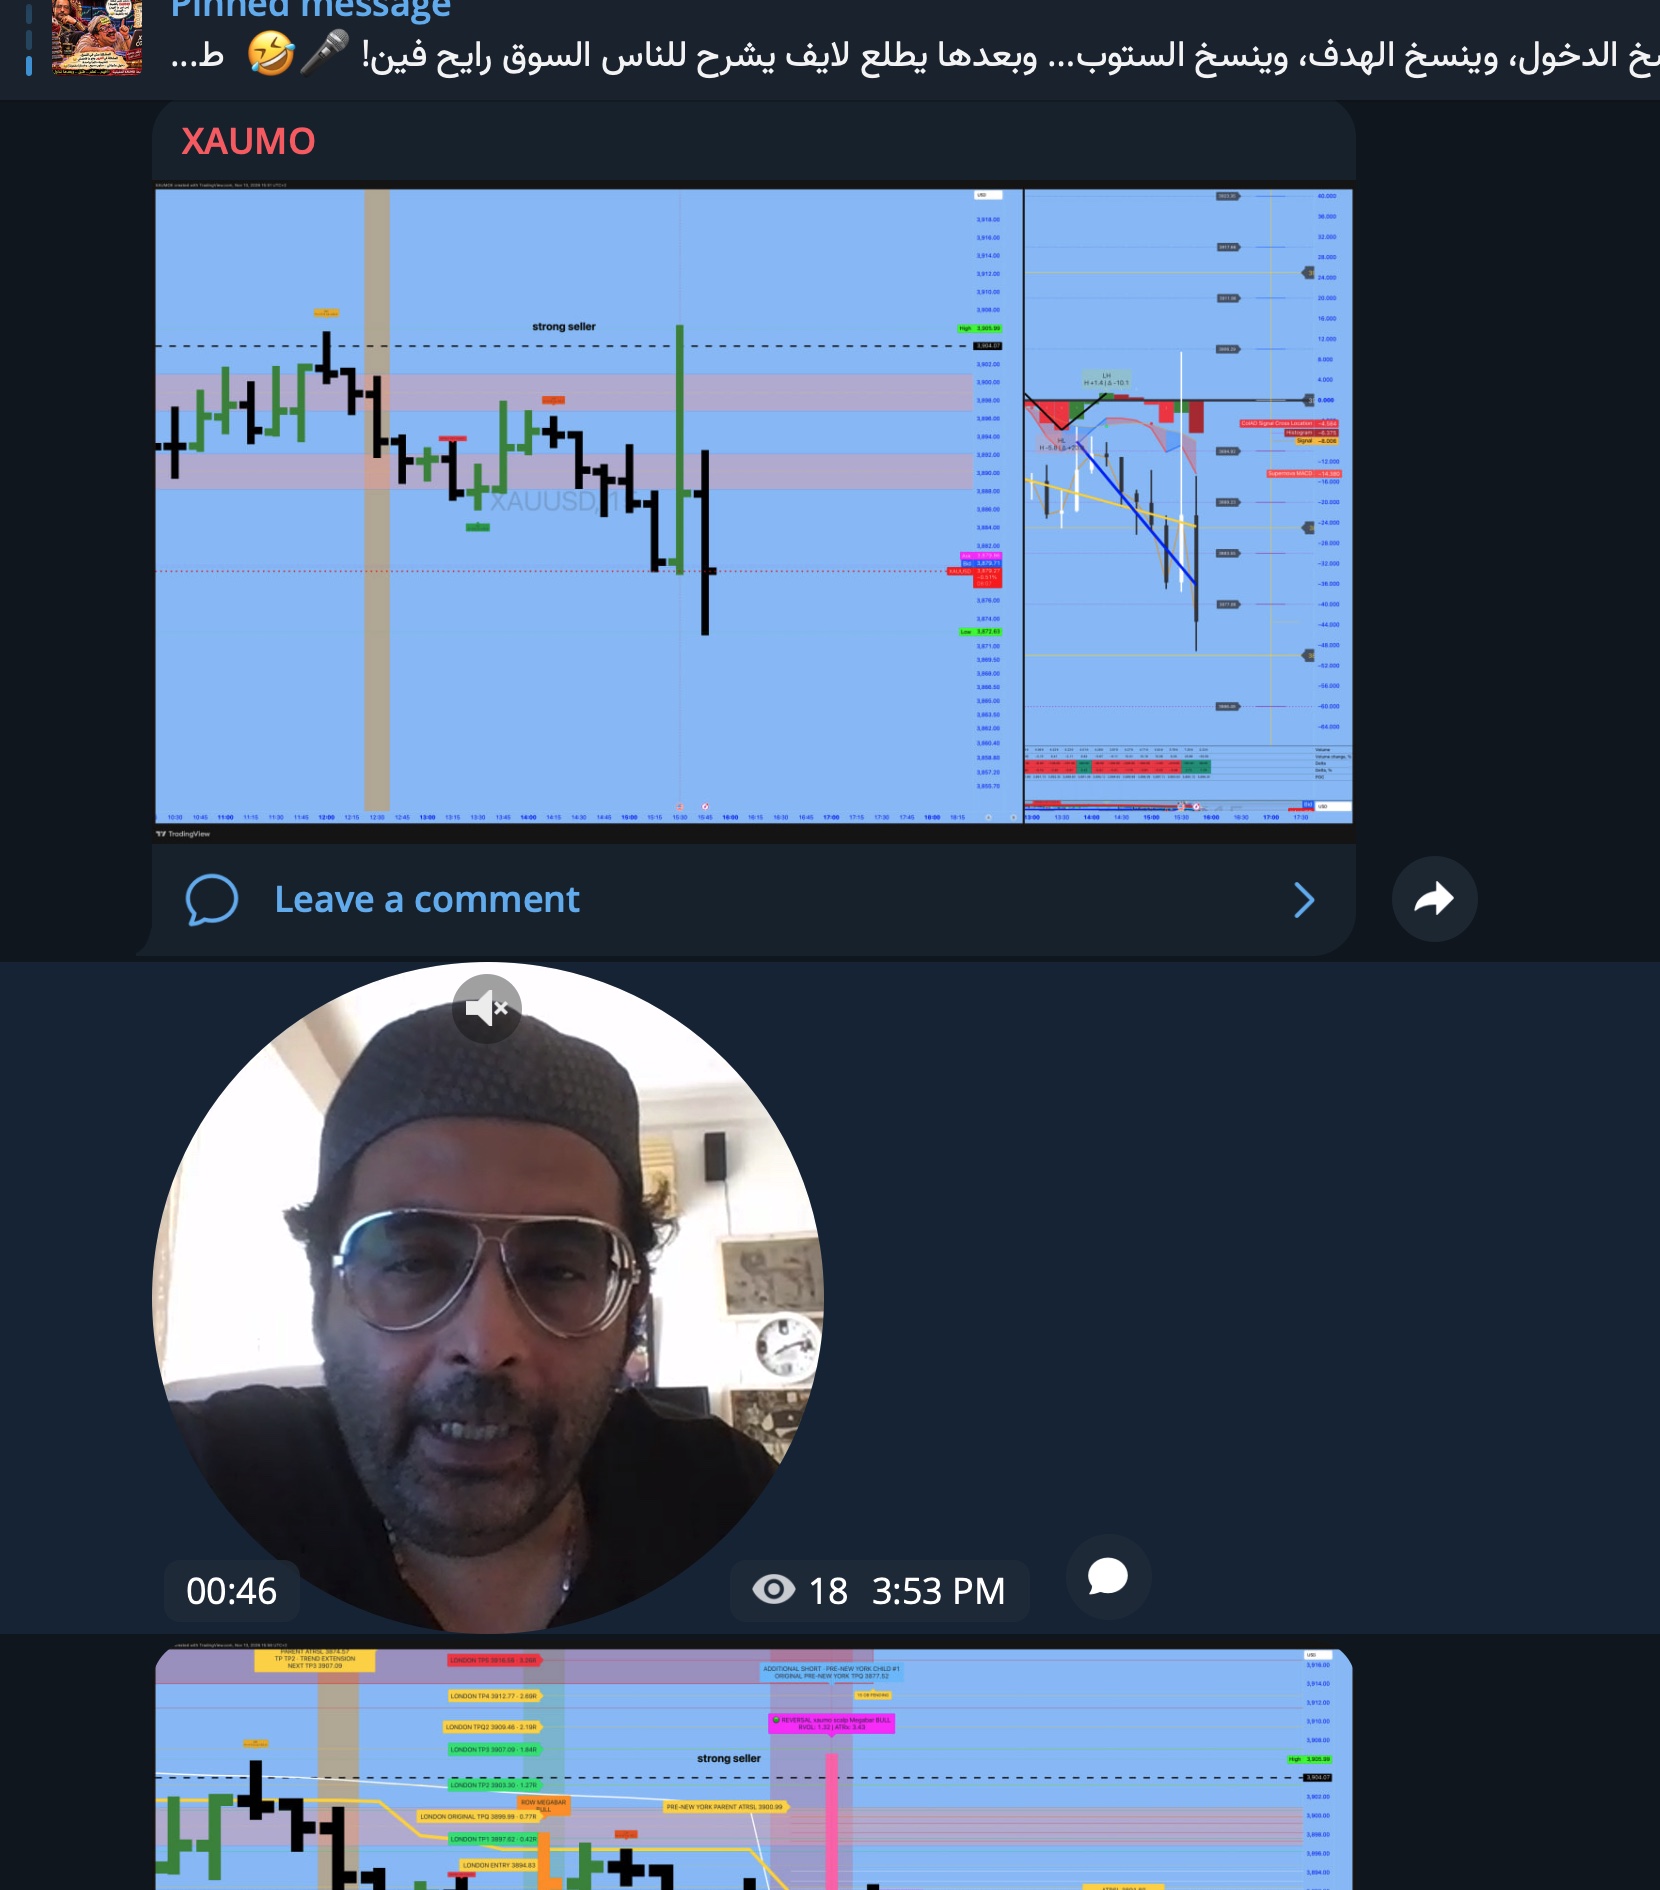
A genuine 46-second Telegram round-video post, published on 13 November 2026 alongside chart studies. Open the original post to watch it.
Original dated Telegram post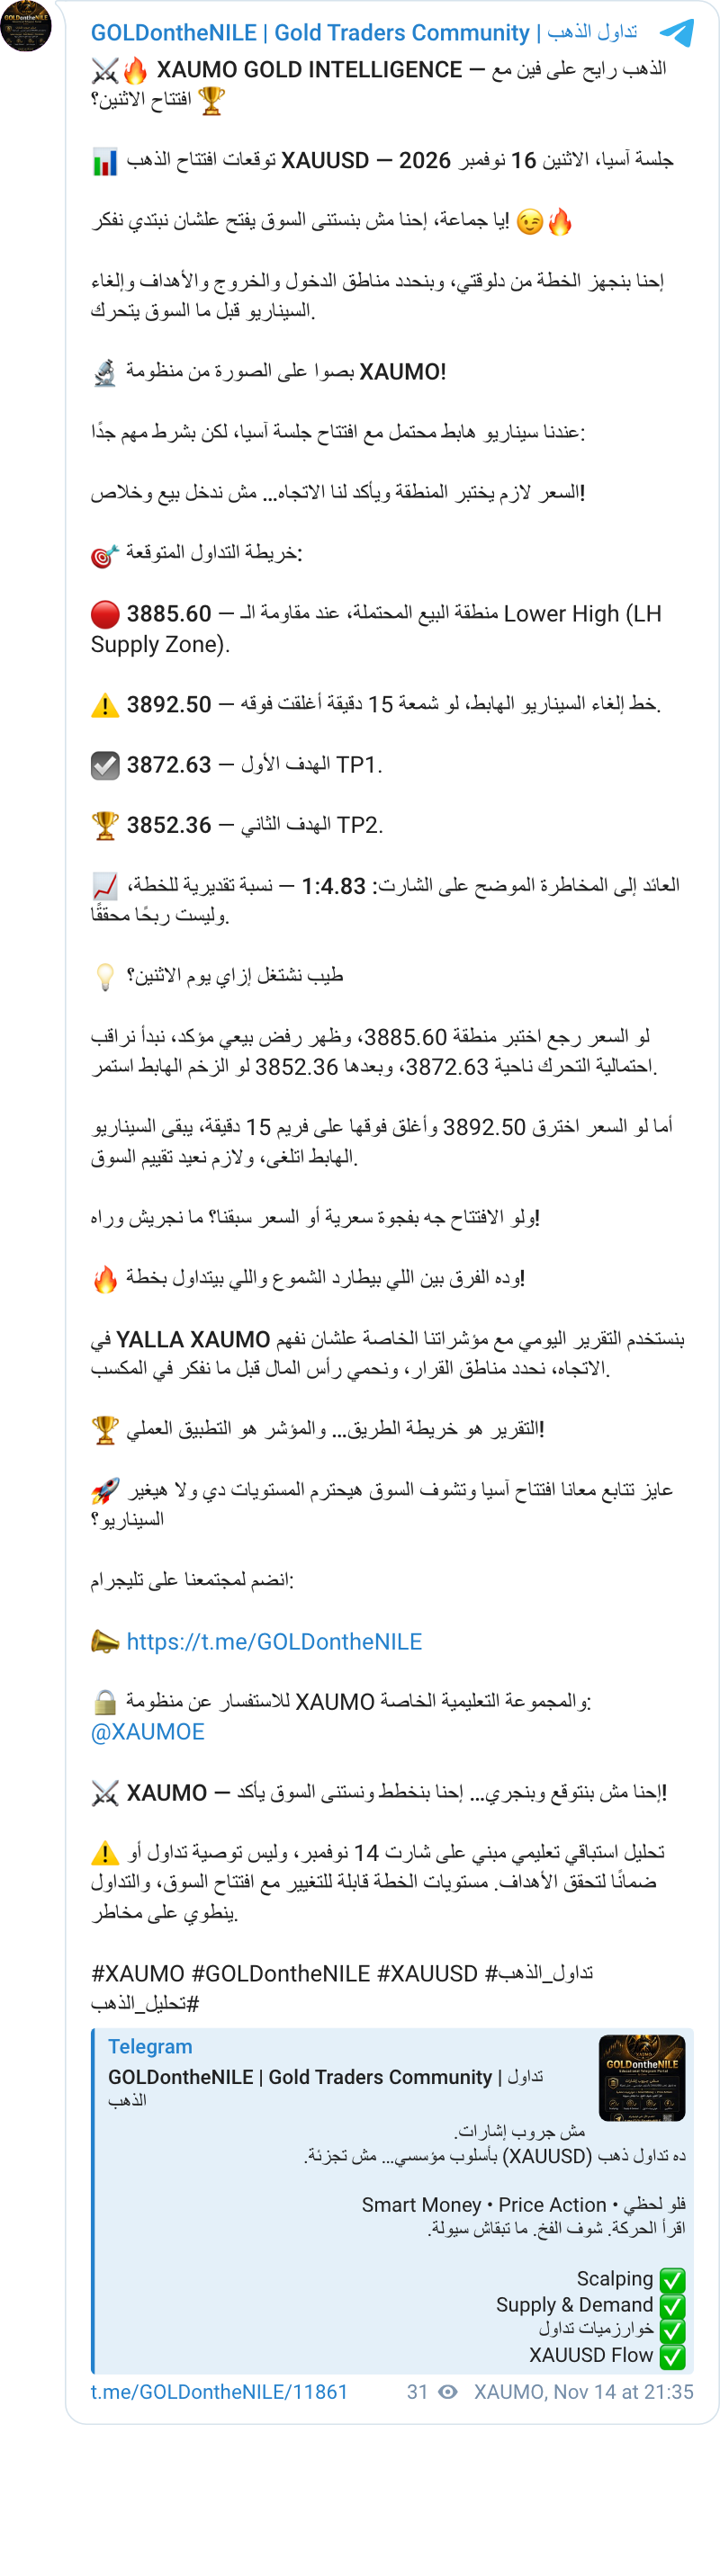
An advance session scenario with clearly labelled conditions, invalidation and historical targets. These are dated examples, not current trade levels.
Original dated Telegram post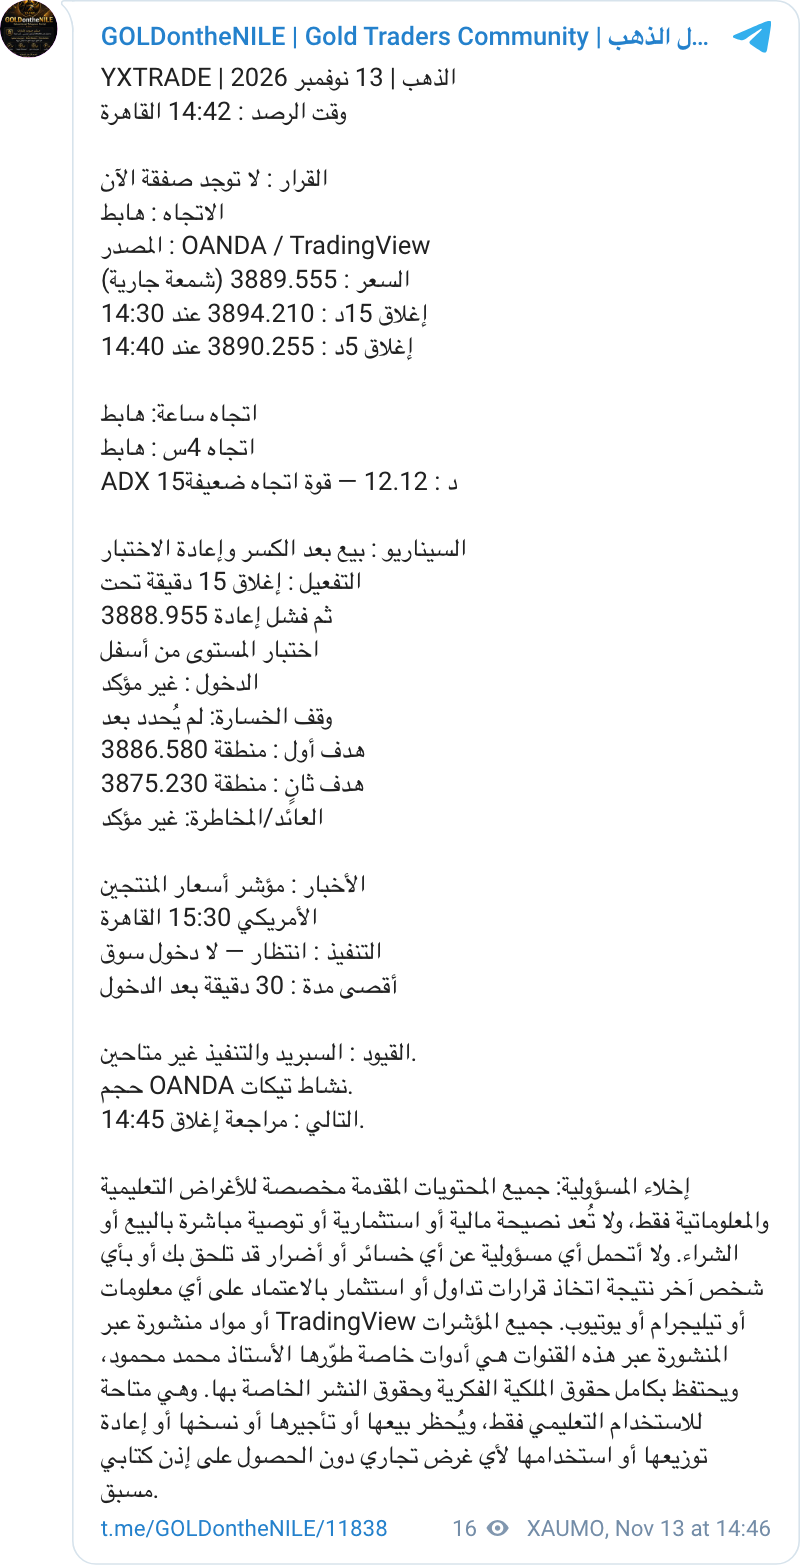
A real 13 November educational update choosing no trade because confirmation and execution conditions were incomplete.
Original dated Telegram postVideos open only after you press play, then Telegram serves the original recording. No personal account or membership is required to read this public page.
Authentic public Telegram video from the founder. Watch the speaker and the historical chart evidence; this is not a live trade signal.
See the dated original postGenuine Telegram round-video evidence.
Open original sourceAll examples are dated historical education, not current signals or a record of executed profits.
XAUMO / المكتبة التحريرية
XAUMO Supernova MACD بيربط الزخم والدايفرجنس والبيفوت وسياق الدخول والخروج بشموع السعر الأصلية. هتفهم التحذير الصاعد والهابط، والفرق بين فرصة محتملة وتنفيذ فعلي، وإزاي التذبذب والـVWAP وهيكل المزاد ممكن يدعموا الفكرة أو يعارضوها. الصور تاريخية مش إشارات لحظية.
صور أصلية من أعمال XAUMO
مواد بحثية تاريخية مؤرخة · ليست إشارات تداول حية
منهج XAUMO
الصورة بتعرض السعر ولوحة المذبذب معًا علشان تراجع توقيت الحدث والتأكيد.
التسميات والقمم والقيعان والقراءات الاتجاهية سياق بحثي، مش أمر تنفيذ أو وعد بالشمعة الجاية.
عرض لقطة المؤشر مش معناه إتاحة الكود الداخلي أو المحركات الخاصة أو فتح اشتراك.
قراءة أعمق
الصورة دي بتوري إزاي بدرس السعر والمذبذب مع بعض، بدل ما أعتبر مجرد تقاطع خطين سبب كافي للدخول. القمم والقيعان والزخم وتوقيت الحركة ممكن تتفسر بشكل مختلف حسب السياق اللي حوالينها.
دي لقطة مؤرخة من بيئة أبحاث XAUMO Supernova MACD، مش توصية حالية ولا دليل مستقل على أرباح تداول. تفاصيل التطبيق والشفرة اللي ما اتنشرتش تفضل ملكية خاصة.
الـMACD بيدرس علاقة المتوسطات المتحركة ببعض، واتساع المسافة بينها، وتغير الزخم. XAUMO Supernova MACD بيربط حركة المذبذب بشموع السعر الفعلية والأحداث المرسومة على الشارت، علشان تعرف أي قمة أو قاع أو شمعة سببت تغير الزخم بدل ما تقرأ خطًا منفصلًا عن السعر.
الهدف إنك تفرق بين تسارع الزخم وضعفه واحتمال استمرار الاتجاه وعلامات الإرهاق المحتملة. قراءة المذبذب جزء من الأدلة، مش إثبات إن الشمعة اللي جاية لازم تتحرك في اتجاه معين.
الدايفرجنس الصاعد ممكن يظهر لما السعر يعمل قاع أقل، بينما المذبذب يعمل قاع أعلى. والدايفرجنس الهابط ممكن يظهر لما السعر يعمل قمة أعلى، بينما المذبذب يعمل قمة أقل. الاتنين تحذير محتمل من اختلاف الزخم، مش انعكاس تلقائي.
الدايفرجنس ممكن يفضل ظاهر كذا شمعة والسوق يكمل في نفس الاتجاه. علشان كده لازم تراجع حركة السعر الحقيقية وإغلاق الشمعة ومستوى إلغاء السيناريو وهيكل السوق والجلسة، وبعدها تقرر هل التحذير اتأكد ولا لأ.
المؤشر ممكن يشرح شروط دخول وخروج محتملة ويربطها ببار السعر والزخم. علامة الدخول معناها إن فيه إعدادًا يستاهل المراجعة عند توقيت وسعر معينين؛ مش معناها إن الوسيط نفذ صفقة. والخروج ممكن يرتبط بهدف، أو ضعف الزخم، أو سقوط شروط السيناريو، أو قاعدة حماية رأس المال.
قبل أي قرار راجع إغلاق الشمعة والاتجاه والسبريد والمسافة لوقف الخسارة وهل العائد المحتمل ما زال مناسبًا للمخاطرة. ولو الدايفرجنس عكس قراءات الاتجاه التانية، الاختلاف ده سبب للتريث، مش رقم ثقة نغطي بيه التناقض.
سوبرنوفا MACD بيسأل عن الزخم. والـVWAP بيسأل السعر فوق أو تحت متوسط التعاملات المرجح بالحجم. منطقة التماسك بتبين التداخل المتكرر، وVolume Profile بيحدد تركز الحجم وحدود القيمة، وTPO بيقيس الوقت عند السعر، وATR بيقيس مدى الحركة الأخيرة. دي قراءات بتكمل بعض ومش بدائل لبعض.
مثلاً السعر يعمل قمة أعلى والـMACD يضعف قرب حد منطقة القيمة في Volume Profile: ده مكان تدرس عنده القبول أو الرفض أو الدايفرجنس المحتمل، مش بيع تلقائي. ولو ظهرت MegaBar في نفس اللحظة، توقيتها وما حصل بعدها بيضيفوا سياق قبل قبول أو رفض فكرة التداول.
MegaBar ممكن يلفت نظرك لحدث غير معتاد في السعر، وسوبرنوفا MACD يساعدك تشوف الزخم والدايفرجنس وسياق علامات الدخول والخروج، وGamma+1 Trader يضيف قراءة الأوبشن والعقود الآجلة والضغط المحتمل من التحوط. كده المتداول يحدد فين يراقب، وفين السيناريو يبوظ، وإمتى عدم الدخول أحسن.
XAUMOBOT مشروع إشعارات مستقل له حوكمته. لو تم تفعيل ربط إشعارات بحثية معتمد للأعضاء مستقبلًا، لازم كل رسالة توضح التوقيت وحداثة البيانات والفرق بين التحليل والتنفيذ. الموقع حاليًا مش بيوصل محركًا خاصًا بإشارة بوت حية أو تنفيذ أمر عند الوسيط.
بص يا معلم، ما ينفعش تشوف المذبذب لوحده وتنسي السعر. Supernova MACD بيربط الـMACD والـHistogram والدايفرجنس بشموع السعر الفعلية، فإنت تشوف القمة أو القاع اللي حصل عنده تغير الزخم، ومش محتاج تخمّن الشمعة المقصودة.
الـHistogram لما يكبر مع نفس الاتجاه ده معناه الزخم بيتسارع في القراءة دي، ولما يصغر يبقى فيه تباطؤ محتمل. لكن مش كل تباطؤ انعكاس. ممكن الترند يكمل عشر شمعات والزخم أقل من الأول.
دايفرجنس هابط يعني السعر يعمل قمة أعلى والـMACD يعمل قمة أقل. دايفرجنس صاعد يعني السعر يعمل قاع أقل والزخم يعمل قاع أعلى. ببساطة، فيه اختلاف بين قوة الدفع وشكل حركة السعر. بس الاختلاف ده لوحده مش صفقة.
تعمل إيه؟ شوف الشمعة قفلت ولا لسه، فيه كسر ورجوع واختبار، في مستوى قيمة أو VWAP أو MegaBar قديمة، وفيه دعم أو مقاومة؟ لو الدايفرجنس ضد الاتجاه القوي، ممكن يبقى تحذير بس؛ استنى دليل سعر بدل ما تبيع القمة المتخيلة.
لو ظهر على الرسم Entry ومعاه SL وTP، اعرف إن ده إطار دراسة للسيناريو وشروط إلغائه وأهدافه، مش معناها إن حسابك اتنفذ عليه أمر. وشوف كمان هل الإشارة Direct ولا Continuation ولا Mirror في النسخة اللي بتراجعها، عشان ما تخلطش بين فكرة الاتجاه وفكرة المراية أو الانعكاس.
السؤال المهم: دخولي بعد تأكيد إيه؟ لو كسر فشل، الوقف عند انهيار أي فرضية؟ والهدف منطقي بالنسبة للتذبذب والسبريد؟ لو مش عارف تجاوب بوضوح، متاخدش العلامة لوحدها كتفويض.
دي نقطة مهمة جدًا: لو الـMACD غيّر زخم أو طبع دايفرجنس، ده كلام عن قوة الحركة. لو MegaBar قالت انعكاس، ده كلام عن حدث سعر وهيكل. لو GAMMA+ قالت Gamma Flip، ده حد مقدّر لنظام التحوط في الأوبشن. التلاتة ممكن يتفقوا وممكن يختلفوا.
لما يتفقوا، لسه محتاجين شمعة تأكيد وخطة مخاطرة. ولما يختلفوا، ما نزوّقش الكلام ونقول نسبة ثقة وهمية. بنوضح للمتداول سبب الخلاف، وساعات بنقول: استنّى.
GOLD ON THE NILE / ORIGINAL COMMUNITY RECORD
بص يا معلم، إحنا في XAUMO مش شغالين نعلّق على الشارت شوية أسهم ونقول للناس اشتروا وبِيعوا. الفكرة إن كل واحد يفهم هو داخل ليه، وإمتى يستنى، والسوق لو عمل عكس المتوقع هيعرف منين إن السيناريو باظ. العلم مش حكر على العضوية الخاصة؛ الشرح والمراجع واللقطات الأصلية من Gold on the Nile متاحة علشان المجتمع كله يستفيد.
هتشوف هنا منشورات حقيقية بتاريخها من مجتمع GOLDontheNILE: فيديو للمؤسس وهو بيتابع الشارت، وخطة اتكتبت قبل الجلسة، ومثال واضح لقرار «مفيش صفقة دلوقتي». روابط كل منشور موجودة علشان تراجع بنفسك. أدواتنا الخاصة وصلاحيات العضوية شيء تاني، وبتتفتح بشكل انتقائي بعد الموافقة.
رسالة فيديو دائرية أصلية مدتها 46 ثانية، منشورة يوم 13 نوفمبر 2026 في Gold on the Nile. الصورة لقطة من تيليجرام نفسه؛ افتح المنشور وشوف التسجيل الأصلي.
افتح المنشور الأصلي بتاريخِهتطبيق عملي لفكرة إننا بنحدد المناطق والشروط قبل ما السعر يجري. المنشور بيفرق بين السيناريو ووجود صفقة منفذة، وبيحط شرط إلغاء واضح. الأرقام بتاريخ 14 نوفمبر ومش مستويات النهارده.
افتح المنشور الأصلي بتاريخِهمش كل شارت لازم ناخد منه صفقة. ده منشور فعلي من 13 نوفمبر بيقول «لا توجد صفقة الآن» لأن شروط التأكيد والسبريد والتنفيذ ما كانتش مكتملة.
افتح المنشور الأصلي بتاريخِهبص يا معلم: دوس تشغيل للفيديو اللي عايزه. وقتها بس هيتفتح الفيديو الأصلي من تيليجرام. مفيش حاجة بتشتغل تلقائي أو تسجيل مطلوب علشان تقرأ الصفحة.
بص يا معلم، ده فيديو حقيقي منشور في الجروب يوم ١٣ نوفمبر، تقدر تسمع فيه المؤسس وتشوف الشارت. مش إشارة تداول حالية.
افتح الفيديو الأصلي بتاريخِهالفيديو منشور بالفعل على Gold on the Nile.
افتح المصدر الأصليكل الصور والأسعار دي أمثلة تعليمية بتاريخها، مش إشارات حالية ولا إثبات لأرباح صفقات منفذة.